Source Detection
Source Detection
(Identifying and Mapping SDS Sources)
Accurate and up-to-date maps are essential for planning and designing effective SDS source management interventions. Identifying and mapping SDS source areas can be a politically sensitive issue. Furthermore, the dynamic nature of SDS sources poses serious challenges to their precise and timely detection. Therefore, countries and regions must decide for themselves which source detection approaches and methods are most appropriate for their specific context and how best to use the results to inform source management decisions.
Geospatial dashboards are increasingly being used in policy and planning frameworks to combat desertification, land degradation, and drought. A collaborative SDS digital platform could provide stakeholders with easy access to datasets, algorithms, models, tools, and GIS applications that would allow them to identify and map SDS sources in a confidential manner.
This module provides an overview of common approaches and methods used to detect SDS sources as part of a basic workflow to obtain, refine, and validate results. The location, frequency, and intensity of SDS sources are continually shifting due to a combination of natural climate variability and anthropogenic pressures. For example, SDS source activity tends to fluctuate throughout the year, typically peaking during the spring and summer months due to increased wind, rising temperatures, decreased vegetative cover, and lower soil moisture. In recent decades, persistent drought, hydrological disruption, and poor water management have become major drivers of new SDS sources.
Basic Workflow for SDS Source Detection
Diverse expertise and resources are required for each step of the workflow, typically beginning with an analysis of remote sensing data and concluding with the incorporation of field data. Identifying and mapping SDS sources based on ground observation data alone is often the most costly method due to the inaccessibility and vast extent of land surface area that is susceptible to wind erosion.
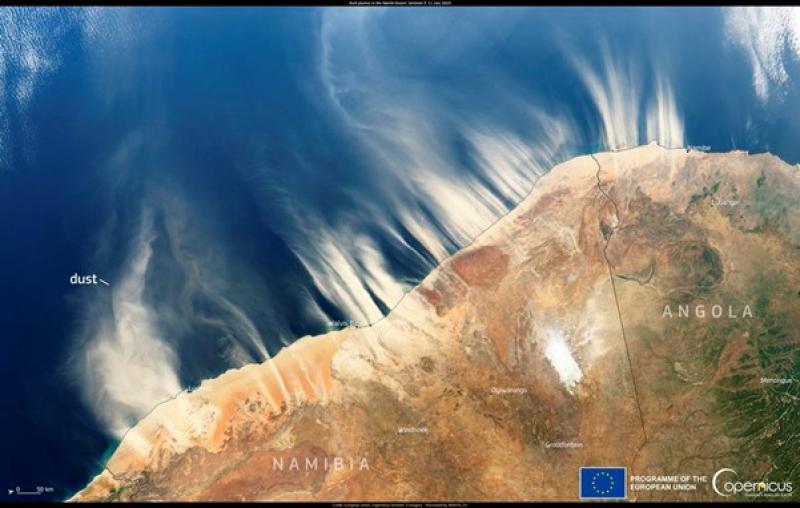
(1) A first-order approximation of where SDS emissions originate can be obtained based on their observed occurrence in the atmosphere. This first step typically involves an analysis of freely available and up-to-date Earth observation datasets describing atmospheric aerosols (e.g., dust optical depth, dust indices, false-colour imagery).
(2) A second-order approximation of SDS source locations involves either refining or validating the results obtained in step 1. This second step typically involves the use of models and machine learning that incorporate metrics or proxies for meteorological and hydrological data, soil and land surface conditions, and anthropogenic pressures.
(3) A final-order approximation builds upon the results obtained in steps 1 and 2 to conduct finer-scale analysis (e.g., drones, LIDAR) and field assessments (e.g., on-site evaluations) for a more precise and robust characterisation of SDS sources that is needed for effective management (e.g., natural vs anthropogenic drivers, climate and geophysical context, ecological dynamics, and dust particle size and composition).
Common Approaches and Methods of SDS Source Detection
The selected references (to the right) illustrate applications of the most commonly used approaches and methods of SDS source detection. They describe the datasets and methodologies, often providing detailed, reproducible procedures for identifying and mapping SDS sources. These approaches and methods can be combined or employed in sequence as suggested by the basic workflow.[1]
Earth Observations (Remote Sensing Data)
Data from satellite sensors are most frequently used to arrive at a first-order approximation of SDS source locations, usually with some indication of the frequency and intensity of SDS emissions. These approaches offer a practical and cost-effective starting point for SDS source mapping based on the expert visual interpretation of remote sensing imagery,[2] [3] back tracing of atmospheric aerosol loads,[4] [5] and modelling (simulation) of long-term aerosol loading – in some cases, incorporating land surface conditions and wind erosion vulnerability.[6] [7]
Widely accessed Earth observation datasets and remote sensing imagery that are regularly updated include NASA’s Moderate Resolution Imaging Spectroradiometer (MODIS), ESA’s Sentinel fleet, or, where available, NASA’s Cloud-Aerosol Lidar and Infrared Pathfinder Satellite Observations (CALIPSO).
The most widely used method to obtain a first-order approximation of SDS source locations is to examine satellite-based data on occurrence of atmospheric aerosols by analysing time-series datasets. These products include Aerosol Optical Depth (AOD), Dust Optical Depth (DOD), Aerosol Index (AI), and Normalized Difference Dust Index (NDDI). Their metrics quantify the extinction of solar radiation by particles within a vertical atmospheric column and can distinguish dust from other atmospheric aerosols and land surfaces, but are often subject to overestimation or underestimation depending on the sensor and region.[8]
Satellites providing timely, high-resolution infrared data (effective in differentiating SDS emissions from cloud cover) can be used for back tracing aerosol plume movements and determining their originating locations and active periods. A backward trajectory analysis, using a model such as the HYSPLIT, can also incorporate dust emission simulations using indicators of surface roughness indicators and soil properties. These methods have been used to study SDS sources in the Middle East and East Asia.[9]
Earth Observations (Remote Sensing Data) | |
|---|---|
Advantages | Disadvantages |
|
|
Modelling Approaches
Modelling approaches generally integrate remote sensing data, meteorological models, and field data to identify and map land surface areas that are susceptible to wind erosion. Key techniques include dust emission modelling, multi-criteria evaluation (e.g., Weighted Linear Combination), trajectory modelling (e.g., HYSPLIT), and artificial intelligence to distinguish sand and dust emissions from bright surfaces and predict hotspots. Increased computing power allows these models to be run with greater horizontal and vertical resolutions to better describe small-scale processes that drive patterns of dust emissions. There are four WMO SDS-WAS regional centres (Barcelona, Beijing, Barbados, and Jeddah) that collect and process data from remotely sensed and ground observations to develop modelling products that support SDS forecasting at regional levels.[10]
Dust emission modelling can provide insights into the location SDS source areas, including an assessment of the frequency and intensity of emissions. However, the accuracy and precision of dust models is often related to the spatial extents over which they are applied, with field- to landscape-scale modelling enabling a more accurate and precise representation of land cover and management practices and their influence on wind erosion patterns.[11] [12] For example, the utility of these models can by limited by their lack of sensitivity to structural changes in vegetation that govern the spatial patterns, frequency, and intensity of SDS emissions.[13] Global and regional dust modelling can also support SDS early warning systems and informs air quality forecasting.
One approach to mapping SDS source potential involves processing global datasets to estimate the soil’s susceptibility to wind erosion based on its physical characteristics, seasonal weather patterns, and land management practices. This method of detection aims to determine the most favourable ground conditions for SDS emissions (i.e., potential new source areas), making it possible to capture previously unknown or infrequent sources areas with localised impacts. The results of this method can be further refined by substituting national or sub-national data, where available, or validated through observations of SDS occurrences.[14]
Modelling Approaches | |
|---|---|
Advantages | Disadvantages |
|
|
Ground Observations (Field Data)
Acknowledging the advantages and disadvantages of using Earth observation data and modelling approaches, thus far the workflow can generate a initial, rough estimation of SDS hotspots or priority areas for further investigation. With sufficient resources, experts can use this information to design and conduct finer scale or site-specific assessments based on ground observations and field data, such as soil, vegetation, and moisture conditions, as well as land and water management practices and other anthropogenic pressures. This approach is the most accurate way to identify and characterise priority hotspots that are often associated with human-induced desertification and land degradation.
Landform, climate, soil, vegetation, and land management data can be used to support integrated assessments of SDS risk that account for their interactions and feedback loops. Field assessments of the susceptibility to wind erosion (risk) that follow standard protocols can enable the aggregation and reuse of data for different source management objectives.[15] For example, indicators of vegetation structure and composition (e.g., height, spacing) combined with benchmarks based on ecological, air quality, or dust emission thresholds, can be used to more precisely describe SDS risk at monitored locations.[16]
Qualitative field assessments that include other indicators (e.g., presence of wind scouring, ripples, coppice dune formation) can inform quantitative monitoring approaches.[17] By directly reflecting the physical processes governing the uplift of particulate matter, these integrated approaches go beyond the current fractional cover metrics used in dust modelling to account for landscape-scale roughness effects across different plant communities and vegetation configurations.[18] Localised dust modelling using field data can also enhance forward air parcel trajectory modelling to better understand potential downwind impacts.[19]
In general, standardised field assessment methods are scalable to different levels of precision, which can dramatically reduce the costs of data collection. Field assessments encourage decision-makers to develop an understanding of the anthropogenic and ecological controls on SDS source areas, which can guide the design and implementation of source management practices (see Module 2).
Ground Observations (Field Data) | |
|---|---|
Advantages | Disadvantages |
|
|
Future Directions
While existing maps can provide valuable insights into the broad spatial distribution and temporal dynamics of SDS source areas, their current resolution and methodological limitations cannot support decision-making at the scale required for cost-effective source management interventions.
Improving the accuracy and cost-effectiveness of SDS source detection approaches, models, and methods will require higher spatial and temporal resolution of remote sensing products. Other necessary advances would include (i) new remote sensing products that describe vegetation structure, (ii) significant advances in GIS processing and the sophistication of wind erosion and dust modelling frameworks, and (iii) easier acquisition of dust emission datasets for model validation. These types of investments would not only enable finer-scale detection of SDS source areas, but also improve the monitoring and evaluation of source management interventions and strengthen early warning systems.
The use of artificial intelligence to leverage remote sensing and field data for SDS source detection is emerging as an alternative to numerical modelling, with the potential of identifying, mapping, and predicting SDS source hotspots in real-time.[20] For example, Random Forest is a machine learning algorithm used to classify dust pixels in satellite imagery by analysing complex, non-linear relationships between meteorological data (e.g., wind speed, precipitation) and environmental factors (e.g., soil moisture, vegetation configuration) to predict susceptibility to wind erosion.[21] [22]
In the future, a geospatial dashboard or data platform, such as those increasingly being used in land use policy and planning frameworks,[23] could be developed to strengthen national capacities and provide stakeholders with easy access to datasets, algorithms, models, tools, and GIS applications that would allow them to identify and map SDS sources in a confidential manner.

[1] UNCCD. (2022). Sand and Dust Storms Compendium Chapter 8: Sand and dust storm source mapping. UNCCD, Bonn. https://www.unccd.int/resources/publications/sand-and-dust-storms-compendium-information-and-guidance-assessing-and
[2] O'Loingsigh, T., et al. (2015). Correction of dust event frequency from MODIS Quick-Look imagery using in-situ aerosol measurements over the Lake Eyre Basin, Australia. Remote Sensing of Environment, 169, 222-231. https://doi.org/10.1016/j.rse.2015.08.010
[3] Sinclair, S.N. and LeGrand, S.L. (2019). Reproducibility assessment and uncertainty quantification in subjective dust source mapping. Aeolian research, 40, 42-52. https://doi.org/10.1016/j.aeolia.2019.05.004
[4] Ginoux, P., et al. (2012), Global-scale attribution of anthropogenic and natural dust sources and their emission rates based on MODIS Deep Blue aerosol products, Reviews of Geophysics, 50, RG3005. https://doi.org/10.1029/2012RG000388
[5] Darvishi Boloorani, A., et al. (2023). Visual interpretation of satellite imagery for hotspot dust sources identification. Remote Sensing Applications: Society and Environment, 29, 100888. https://doi.org/10.1016/j.rsase.2022.100888
[6] Kim, D., et al. (2024). Where dust comes from: Global assessment of dust source attributions with AeroCom models. Journal of Geophysical Research: Atmospheres, 129(16), e2024JD041377. https://doi.org/10.1029/2024JD041377
[7] Wang, N., and Zhang, Y. (2024). Long-term variations of global dust emissions and climate control. Environmental Pollution, 340, 122847. https://doi.org/10.1016/j.envpol.2023.122847
[8] Darvishi Boloorani, A., et al. (2025). Global map of characterized dust sources using multisource remote sensing data. Scientific Reports, 15(1), 29805. https://doi.org/10.1038/s41598-025-14794-3
[9] Yu, W., et al. (2024). Assessment of Soil Wind Erosion and Population Exposure Risk in Central Asia’s Terminal Lake Basins. Water, 16(13). https://doi.org/10.3390/w16131911
[10] See: https://wmo.int/topics/sand-and-dust-storms
[11] Pierre, C., et al. (2022). Wind erosion response to past and future agro-pastoral trajectories in the Sahel (Niger). Landscape Ecology, 37(2). https://link.springer.com/article/10.1007/s10980-021-01359-8
[12] Edwards, B.L., et al. (2022). Parameterizing an aeolian erosion model for rangelands. Aeolian Research, 54. https://www.sciencedirect.com/science/article/pii/S1875963721001063
[13] Webb, N.P., Okin, G.S., and Brown, S. (2014). The effect of roughness elements on wind erosion: The importance of surface shear stress distribution. Journal of Geophysical Research: Atmospheres, 119(10). https://agupubs.onlinelibrary.wiley.com/doi/full/10.1002/2014JD021491
[14] Vuković Vimić, A., Cvetkovic, B., and Kang, U. (2024). Sand and Dust Storms Source Base-map: An Innovative Approach to Identifying Potential Sources. Technical Brief. UNCCD, Bonn. https://www.unccd.int/resources/brief/global-sand-and-dust-storm-source-base-map
[15] Herrick, J.E., et al. (2005). Monitoring manual for grassland, shrubland and savanna ecosystems. Volume I: quick start. Volume II: design, supplementary methods and interpretation. https://landscapetoolbox.org
[16] Webb, N.P., et al. (2020). Indicators and benchmarks for wind erosion monitoring, assessment and management. Ecological Indicators, 110. https://www.sciencedirect.com/science/article/pii/S1470160X19308763?via %3Dihub
[17] Wheeler, B., et al. (2024). Integrating erosion models into land health assessments to better understand landscape condition. Rangeland Ecology & Management, 96. https://www.sciencedirect.com/science/article/pii/S1550742424000769
[18] Webb, N.P., et al. (2021). Vegetation canopy gap size and height: Critical indicators for wind erosion monitoring and management. Rangeland Ecology & Management, 76. https://www.sciencedirect.com/science/article/pii/S1550742421000130
[19] Treminio, R.S., et al. (2025). Dust transport pathways from The Great Basin. Aeolian Research, 72. https://www.sciencedirect.com/science/article/pii/S1875963724000697
[20] Jiao, P., et al. (2021). Next-generation remote sensing and prediction of sand and dust storms: State-of-the-art and future trends. International Journal of Remote Sensing, 42(14). https://doi.org/10.1080/01431161.2021.1912433
[21] Wang, W. et al. (2023) Machine learning-based prediction of sand and dust storm sources in arid Central Asia, International Journal of Digital Earth, 16:1, 1530-1550. https://doi.org/10.1080/17538947.2023.2202421
[22] Lary, D.J., et al. (2016). Machine learning in geosciences and remote sensing. Geoscience Frontiers, 7(1), 3-10. https://dx.doi.org/10.1016/j.gsf.2015.07.003