Risk Assessment Visualization Tool
Follow these steps to review and analyze the Drought Risk calculations in your location.
- 1. Select a dataset
-
Use the dropdowns on the top left to select what data you want to explore

In the dropdown select the indicator you want to visualize
Please note: For Land cover change, you can switch between “from” and “to”.
- 2. Choose what is on the display
-
You can use the “layer” button in the top right to select what to display
A background map, loaded from an external source not associated with UNCCD data (currently the tool offers maps from Esri and Google) The indicator layer (only one is shown at a time. Use the toggle to show/hide the selected data layer)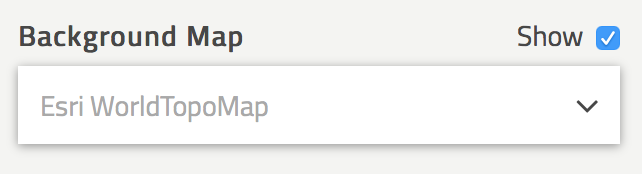
Please note: Using the toggle to show/hide the data layer you can quickly switch between the data view and the background map view.
- 3. Access additional information
-
Use the buttons at the top to select additional information to display for the selected indicator.

Map: Access the maps related to the indicator Metadata: Access the metadata, which includes a description and further information related to the data sources Legend: Toggle the view of a legend indicating the colors used to display the data on the map
- 4. Add or remove pins on the map
-
Use your mouse to place a pin on the map.

Click a location on the map to place a pin To remove a pin, click on the close "x" button
About data and metadata
- Data
-
The drought risk assessment in this tool has been completed by the Joint Research Centre of the European Commission and is applicable for 2000-2018. It uses a global-scale top-down data-driven approach that is consistent and applicable to all regions of the world. The maps are a first screening analysis and it is recommended that local assessments of risk are carried out to improve the outputs for targeting of drought preparedness and appropriate drought mitigation solutions. The outputs of the drought risk assessment provide a relative measure of drought risk globally – that is, the scale of risk is not a measure of absolute losses or actual damage to human health or the environment, but a ranking and comparison of specific geographic regions.
The data presented here has been provided by the European Commission (EC) and the Joint Research Center (JRC) and is based on the research as documented in the report: Carrão, H., Naumann, G., & Barbosa, P. (2016). Mapping global patterns of drought risk: An empirical framework based on sub-national estimates of hazard, exposure, and vulnerability. Global Environmental Change, 39, 108-124. doi:10.1016/j.gloenvcha. 2016.04.12
- Metadata for hazard
-
Drought risk is assessed for the period 2000–2018 and is based on the product of three independent determinants: hazard, exposure, and vulnerability. This dataset contains the data on Hazard. Drought hazard is derived from an analysis of historical precipitation deficits The Full Data Reanalysis Monthly Product Version 6.0 of the Global Precipitation Climatology Centre (GPCC).
- Metadata for exposure
-
Drought risk is assessed for the period 2000–2018 and is based on the product of three independent determinants: hazard, exposure, and vulnerability. This dataset contains the data on Exposure. Drought exposure is based on an aggregation of indicators of population and livestock densities, crop cover and water stress. Global agricultural lands in the year 2000 Gridded population of the world, version 4 (GPWv4) Gridded livestock of the world (GLW), v2.0 Baseline water stress (BWS).
- Metadata for vulnerability
-
Drought risk is assessed for the period 2000–2018 and is based on the product of three independent determinants: hazard, exposure, and vulnerability. This dataset contains the data on Vulnerability. Drought vulnerability is computed as the composite of factors of social, economic and infrastructural indicators, collected at both the national and subnational levels
- Metadata for risk
-
Drought risk is assessed for the period 2000–2018 and is based on the product of three independent determinants: hazard, exposure, and vulnerability. It is calculated with a geometric mean following this equation: Risk = (Hazard x Exposure x Vulnerability) ^ (1/3).

This drought risk assessment tool has been completed by the Joint Research Centre of the European Commission and is applicable for 2000-2018. Carrão et al. (2016) should be consulted for detailed information on the methodology.